Case 04 / TikTok Shop
TikTok Shop sales and profit: Q1 2026
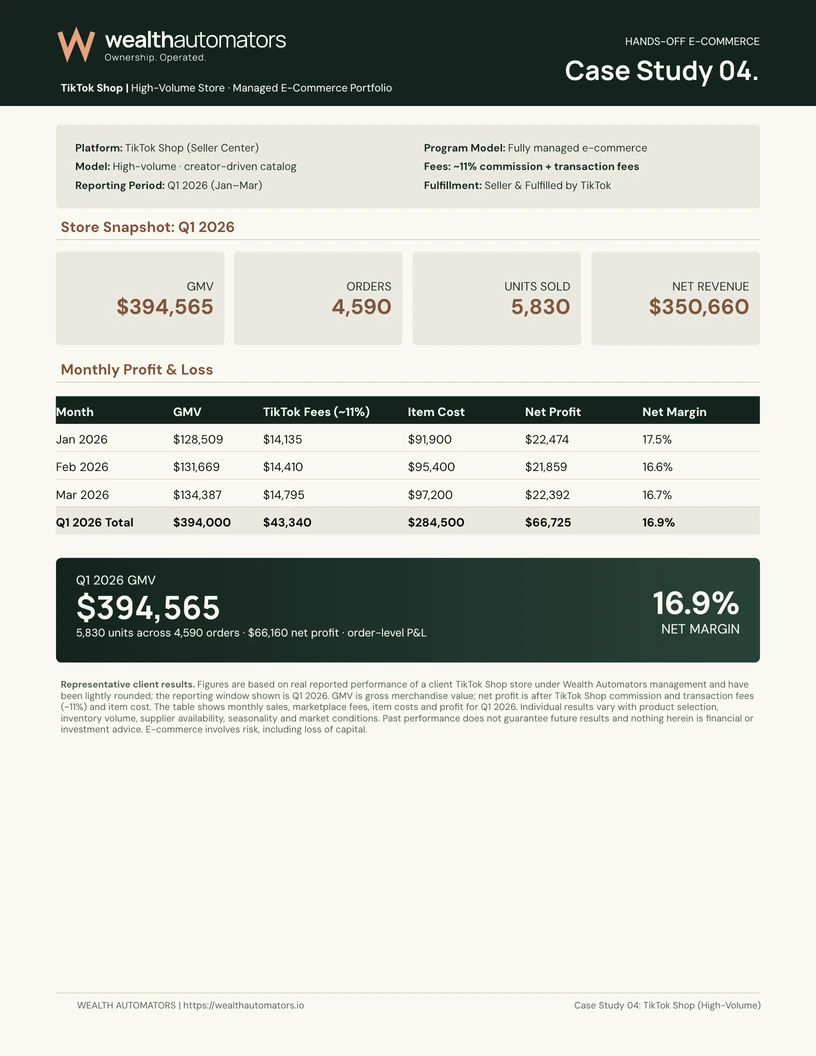
Quarterly TikTok Shop store snapshot with gross merchandise value (GMV), net revenue, units, orders, fees, item costs, and monthly profit.
Open the report (PDF)WHAT THIS REPORT SHOWS
Store performance at a glance.
Distinguish gross merchandise value from net revenue and profit after the stated costs.
- Marketplace
- TikTok Shop
- Reporting period
- January–March 2026
- Source
- Wealth Automators case-study deck
About this case study
- Platform: TikTok Shop (Seller Center)
- Program Model: Fully managed e-commerce
- Model: High-volume · creator-driven catalog
- Fees: ~11% commission + transaction fees
- Reporting Period: Q1 2026 (Jan–Mar)
- Fulfillment: Seller & Fulfilled by TikTok
Understanding the figures
Read sales, product costs, fees and reported profit for the period shown. Different stores may cover different dates or include different expenses. The report includes the calculation notes and disclosures for this example.
This is a selected historical example. Results vary and do not predict what another store will earn.
Company-provided figures from the Wealth Automators case-study deck. No independent financial verification is implied.
THE REPORT IN TEXT
Read the reported figures.
The tables below reproduce the figures in the company-provided report. Read them alongside its summary and calculation notes. Amounts, rounding and reporting periods are retained as supplied.
Monthly profit and loss: Q1 2026
Scroll horizontally to view all columns on smaller screens.
| Month | GMV | TikTok Fees (~11%) | Item Cost | Net Profit | Net Margin |
|---|---|---|---|---|---|
| Jan 2026 | $128,509 | $14,135 | $91,900 | $22,474 | 17.5% |
| Feb 2026 | $131,669 | $14,410 | $95,400 | $21,859 | 16.6% |
| Mar 2026 | $134,387 | $14,795 | $97,200 | $22,392 | 16.7% |
| Q1 2026 Total | $394,000 | $43,340 | $284,500 | $66,725 | 16.9% |
Source calculation notes and disclosure
Representative client results. Figures are based on real reported performance of a client TikTok Shop store under Wealth Automators management and have been lightly rounded; the reporting window shown is Q1 2026. GMV is gross merchandise value; net profit is after TikTok Shop commission and transaction fees (~11%) and item cost. The table shows monthly sales, marketplace fees, item costs and profit for Q1 2026. Individual results vary with product selection, inventory volume, supplier availability, seasonality and market conditions. Past performance does not guarantee future results and nothing herein is financial or investment advice. E-commerce involves risk, including loss of capital.
Let’s talk about your next business.
Talk through the model, capital and next steps.