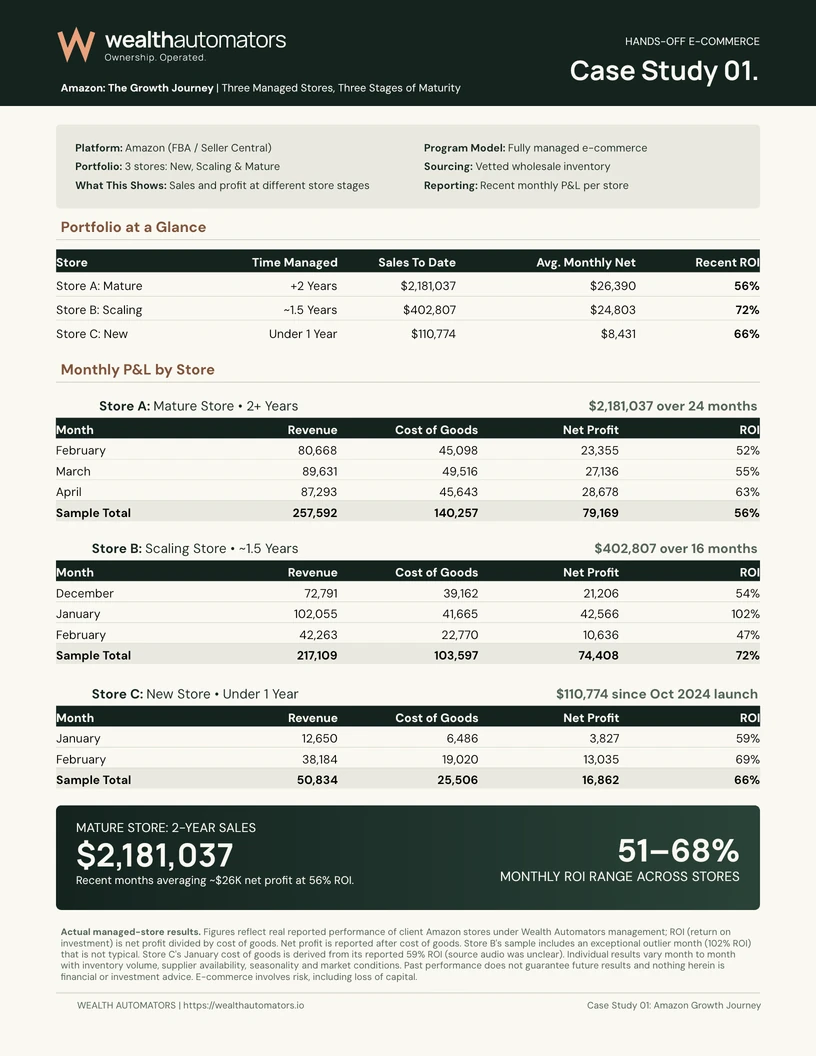
| 3 Amazon stores at different stagesAmazon | Multiple store periods | Store A: Mature: $2,181,037Store B: Scaling: $402,807Store C: New: $110,774 | Store A: Mature: $26,390Store B: Scaling: $24,803Store C: New: $8,431 | 3 stores; sales-to-date and average monthly net profit cover different periods. The highlighted 51–68% ROI range is the report’s summary range, not the lowest and highest monthly rows. Individual rows include 47% and 102%; the source identifies 102% as an exceptional outlier. |
|---|
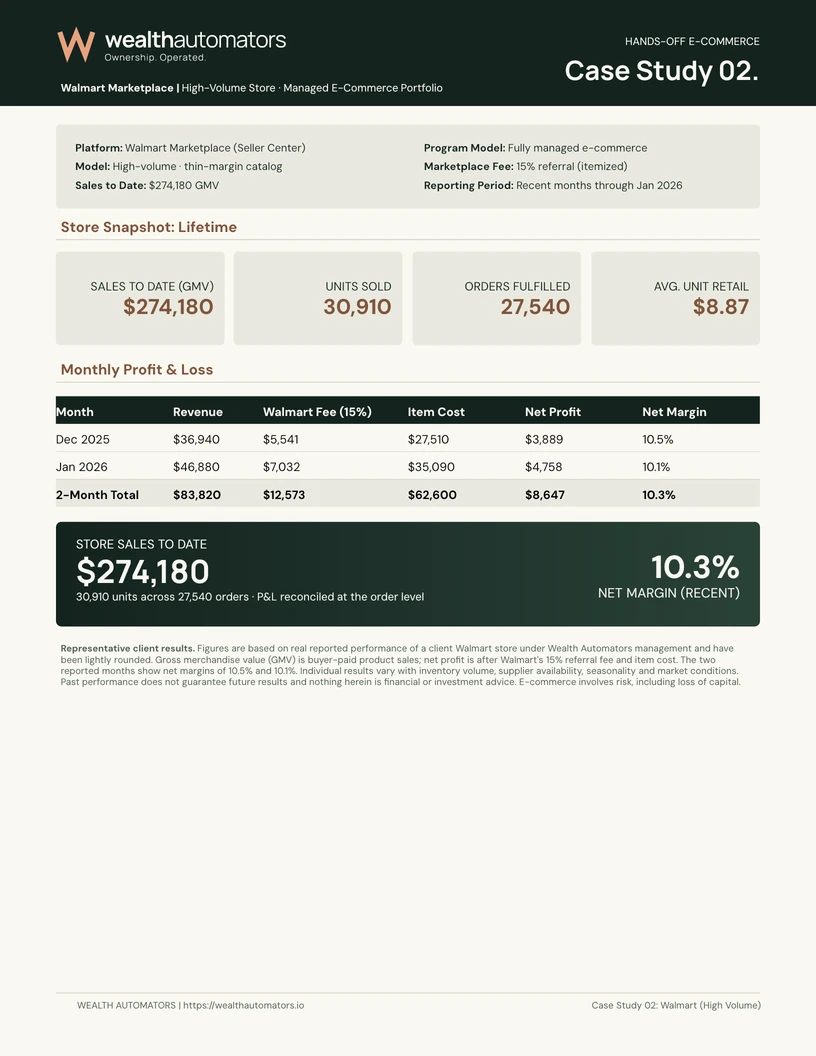
| Walmart sales and profit: December 2025–January 2026Walmart Marketplace | December 2025–January 2026 (2-month table) | $83,820 | $8,647 | 1 store; sales and reported net profit, source table totals. |
|---|
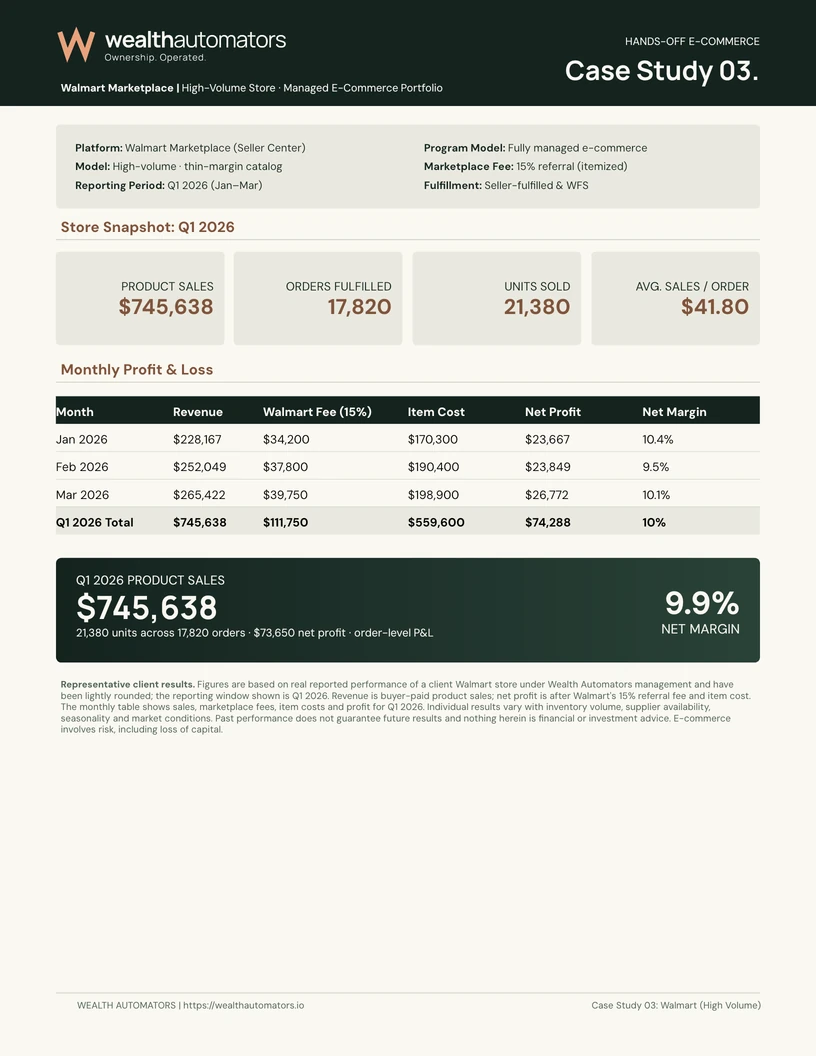
| Walmart sales and profit: Q1 2026Walmart Marketplace | January–March 2026 | $745,638 | $74,288 | 1 store; sales and reported net profit, source table totals. The monthly table reports $74,288 net profit; the report’s headline states $73,650. The source does not explain the $638 difference, so both are retained under their original labels. |
|---|
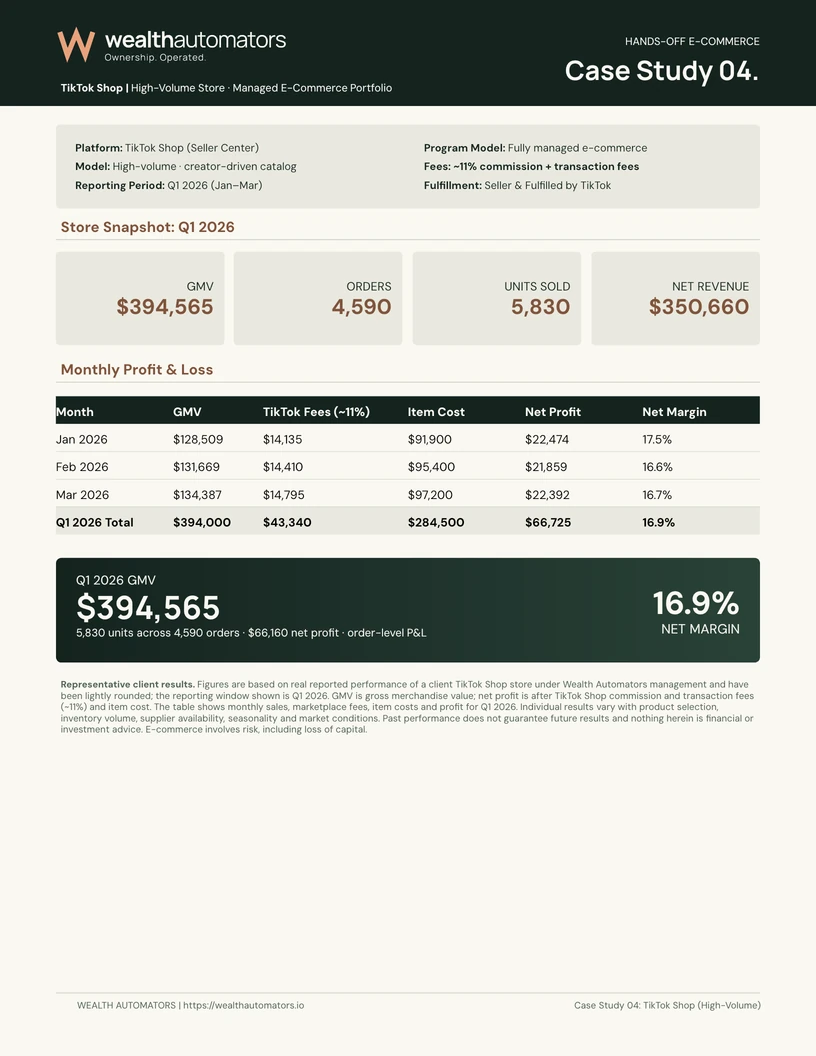
| TikTok Shop sales and profit: Q1 2026TikTok Shop | January–March 2026 | $394,000 | $66,725 | 1 store; GMV and reported net profit, source table totals. The monthly GMV rows total $394,565; the source total is $394,000. The table reports $66,725 net profit and the headline states $66,160. These source differences are retained; no adjustment has been assumed. |
|---|
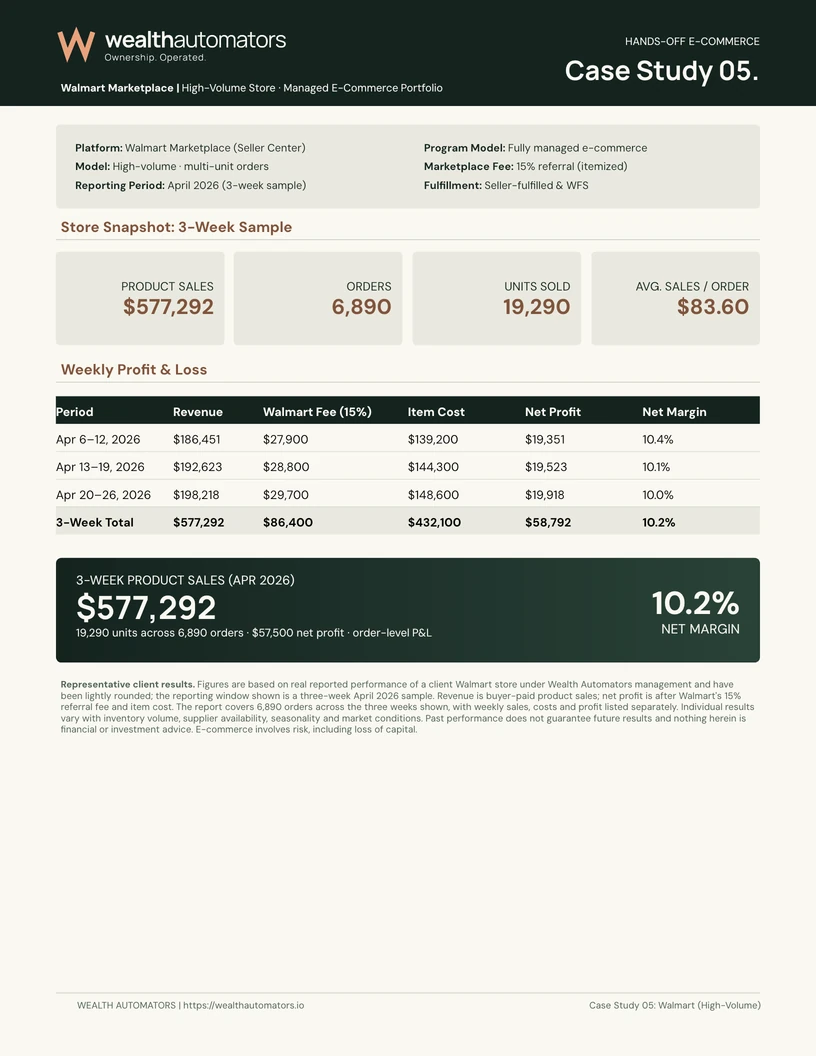
| Walmart sales and profit: a 3-week sampleWalmart Marketplace | April 6–26, 2026 | $577,292 | $58,792 | 1 store; sales and reported net profit, source table totals. The weekly table reports $58,792 profit and the headline states $57,500. The source does not explain the $1,292 difference. |
|---|
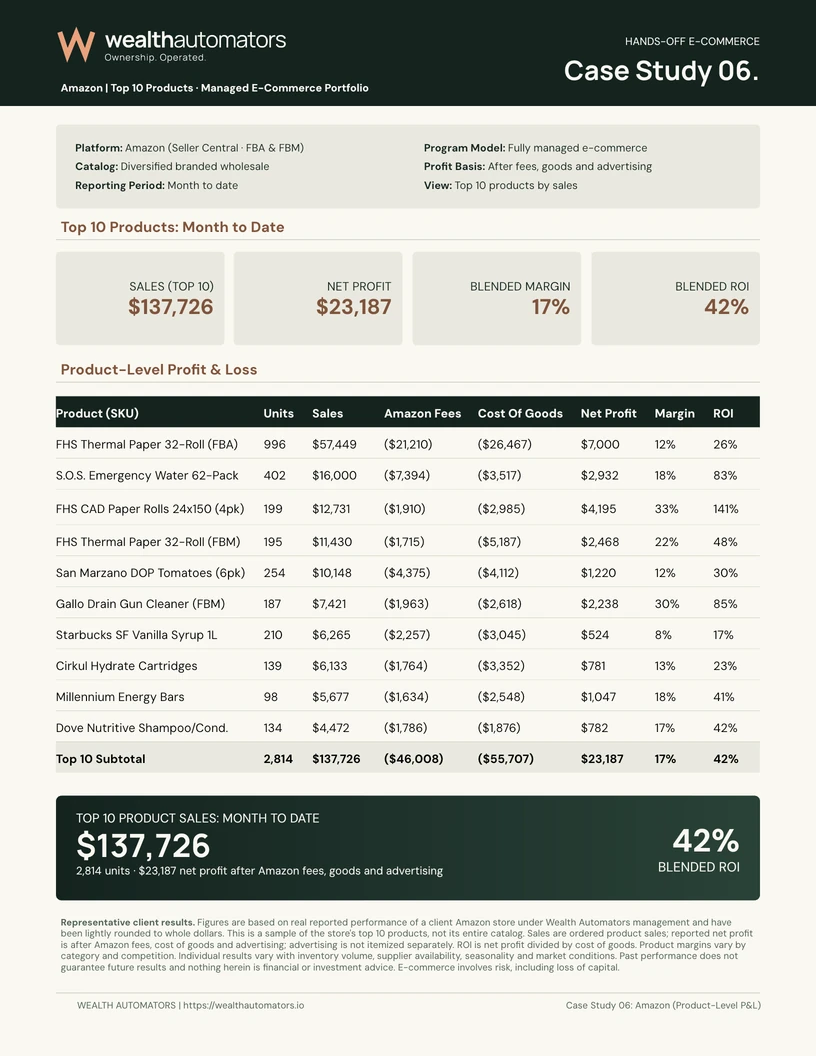
| Sales and profit from 10 Amazon productsAmazon | Month to date; calendar month unspecified | $137,726 | $23,187 | Ten selected products, not the full store. The source labels this a month-to-date product sample but does not provide the exact cutoff date. It is not a complete store or full-month result. |
|---|
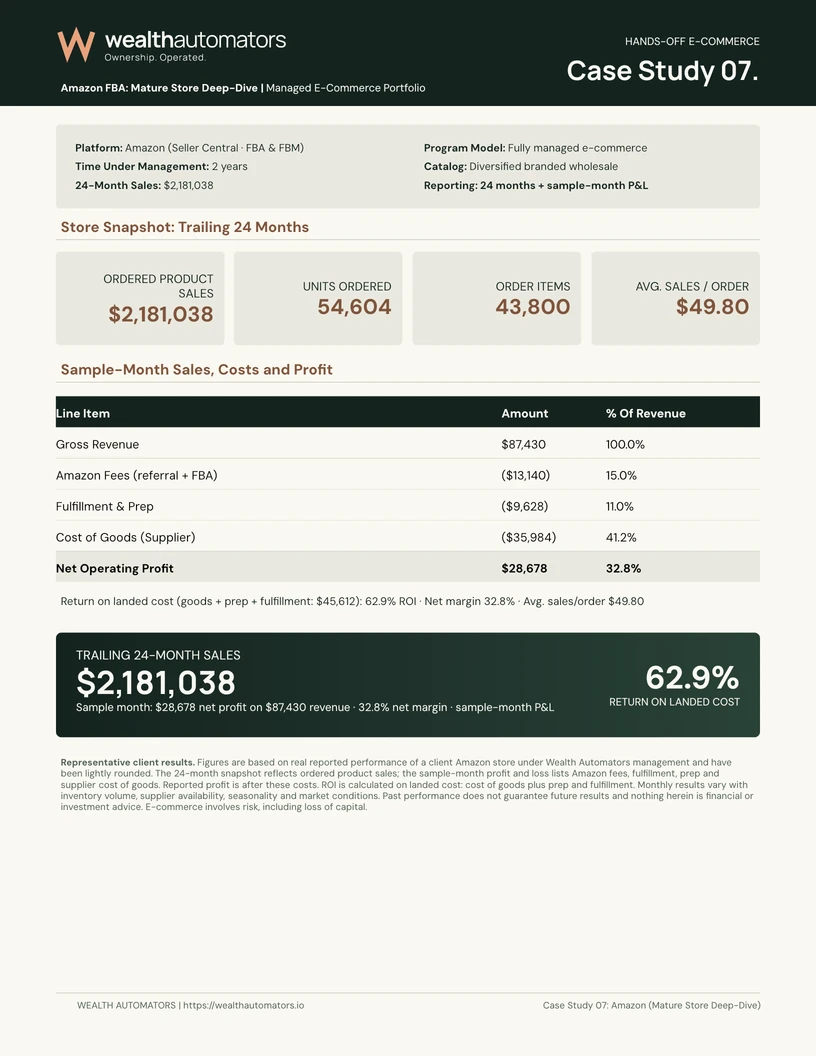
| A mature Amazon store: sales and monthly profitAmazon | Sample month; calendar date not provided | $87,430 | $28,678 | One sample-month P&L; separate from the 24-month sales snapshot. The 24-month sales snapshot and sample-month profit statement cover different periods. The source does not identify the sample month by calendar date. |
|---|
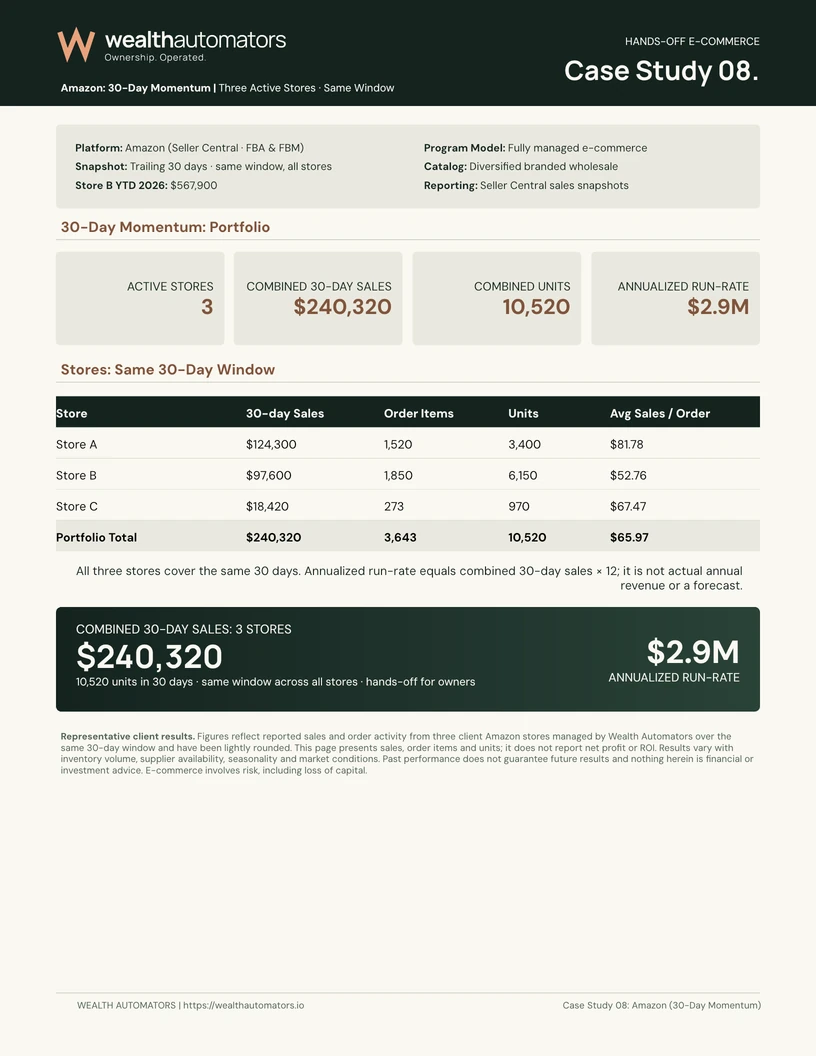
| 3 Amazon stores over the same 30 daysAmazon | Same trailing 30-day window | $240,320 | Not reported | 3 stores in the same 30-day window; sales only. The source describes a shared 30-day window without its calendar start and end dates. These are sales and order figures, not profit or ROI. |
|---|
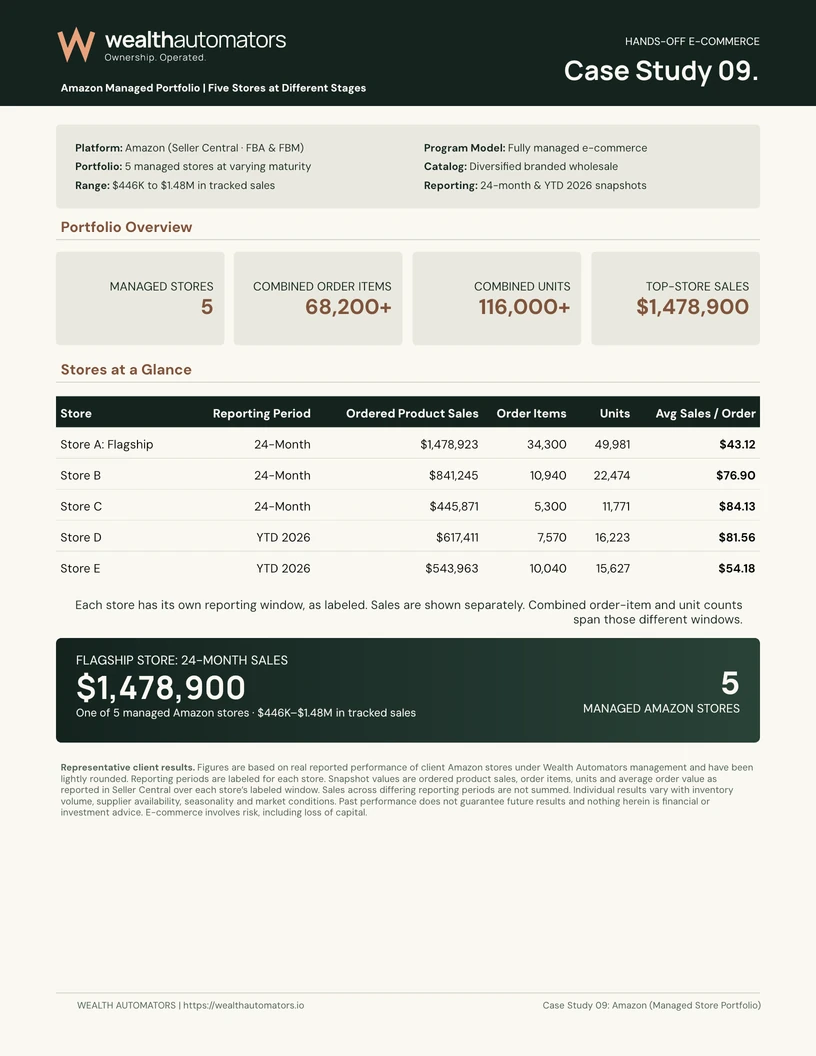
| Sales across a 5-store Amazon portfolioAmazon | 24 months for 3 stores; YTD 2026 for two | Store A: Flagship: $1,478,923 (24-Month)Store B: $841,245 (24-Month)Store C: $445,871 (24-Month)Store D: $617,411 (YTD 2026)Store E: $543,963 (YTD 2026) | Not reported | 5 stores; mixed periods, no combined sales total. |
|---|